


law of demand.
 |
| law of demand. |
Law of Demand.
It's necessary to the difference between Demand and Desire.
.Desire.
-willing to purchase.
.Demand.
-willing to purchase.
-able to purchase.
.Demand.
It is referred to the quantity of a commodity which consumers are able and ready to purchase at different prices.
Demand=Desire + Power of Purchasing.
Law of Demand.
Alfred Marshall has defined it as “If other things remain, the same, the amount demanded increases with a fall in and diminishes with a rise in price.”
Price Quantity of Demand.
1 5000
2 4000
3 3000
4 2000
5 1000
The demands of the law can be explained with the help of the following schedule and graphs.

Here, "other things remain the same" means consumer income, Habits, Taste, Fashion, traditions, prices of substitution, etc.
*Condition of the law of demand.
1. Consumer income.
Consumer income plays an important role in purchasing an item. An increase in consumer income-increase in demand while lower-income leads to lower demand.
2. Prices of substitution goods.
Demand for a commodity has a profound effect on the prices of its substitutes. Demand increases when the prices of substitutes increase and demand decreases when the prices of substitutes fall.
3. Taste and fashion.
The law is that there should be no change in the taste and fashion of the consumer. If fashion changes So consumers despite the price increase, consumers want to buy it.
4. The expectation for change price.
If the consumer expects that the price of X-commodity is increase in the future so he purchases X-commodity more units of-x.
If the consumer expects that the price of X-commodity is decreased so he Will reduce purchases of x-units.
*Expansion and Contraction of Demand.

-Expansion of Demand.
When the demand for an item increases due to the decrease in its price, Such an increase is called expansion of demand.
This can be explained by the following schedule and graph:
Price Q.D
10 10
9 20
8 30
7 40
6 50
5 60
Diagram:

The graph above shows that as the price decreases, so does the demand.
Contraction of Demand:
When the demand for an item decreases due to the increase in its price, Such a decrease is called contraction of demand.
This can be explained by the following schedule and graph:
Price Quantity demand.
5 606 50
7 40
8 30
9 20
10 10
Diagram:

Price Increase Demand Decrease.
Price Decrease Demand Increase.
*Increase and Decrease in Demand.
OR
Rise and Fall in Demand.

Increase in Demand.
When an increase in the quantity of a commodity is due to any reason other than a decrease in its price, such an increase is called the increase in demand.
This can be explained by the following schedule and graph:
Price Q. D Q. D
9 20 30
8 30 40
7 40 50
6 50 60
5 60 70
Diagram:
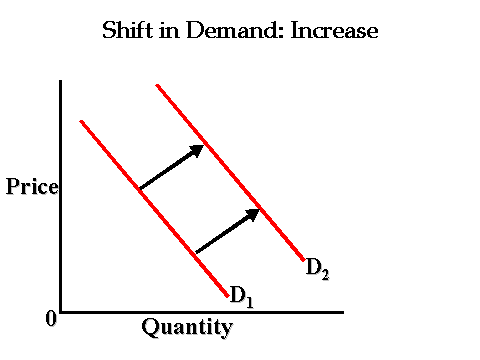
In the figure above, DD' indicates that the demand has increased without any reduction in price.
Decrease in Demand.
When a decrease in the quantity of a commodity is due to any reason other than a decrease in its price, such a decrease is called the decrease in demand.
This can be explained by the following schedule and graph:
Price Q.D Q.D
5 60 50
6 50 40
7 40 30
8 30 20
9 20 10
Diagram:
Shift in Demand Decrease

In the figure above, D'D indicates that the demand has decreased without any reduction in price.
*Measurement of Price Elasticity.
(i) Total Outlay Method,
(ii) Proportional Method,
(iii) Geometrical Method,

(i) Total Outlay Method.
Total Outlay is a way to calculate the price elasticity of the demand method by looking at the effect of changes in price on the revenue earned by the producer.
This method analyses the relationship between the price of the commodity and
the total revenue earned by the seller. Under this method, the elasticity of
demand can be expressed in three ways, i.e., unitary elasticity, greater than
unity elasticity, and less than unity elasticity.
a. Unitary Elasticity:(e = 1)
If the quantity demanded of a product changes due to a change in price and the total outlay of the consumer remains constant, then the elasticity of demand will be equal to unity.

b. Greater-than-unity Elasticity.
If the quantity demanded of a product rises due to a fall in its price which results in the total outlay of the consumer increasing, the elasticity of demand will be more than unity.
(e > 1) P ↑ O↓, P ↓ O ↑

c. Less-than-unity Elasticity.
If a fall in the price results in the quantity demanded the product increases and the total outlay of the consumer falls, the elasticity of demand would be less than unity.
(e < 1) P ↑ O ↑, P ↓ O↓

(ii) Percentage Method:
The previous method only showed us the extent of elastic demand. With the percentage method, we are able to be more precise as to how elastic the demand is.
This method is applied in two cases:
(i) Point elasticity of demand.
(ii) Arc elasticity of demand.
(i) Point elasticity of demand.
When there is a small change in the quantity demanded of a product in response to a small change in its price, there will appear a point on the demand curve. The measurement of elasticity of demand at that point is called "point elasticity of demand" (ii) Arc elasticity of demand.
In order to apply the percentage method in either of the two cases,
the ratio between the percentage change in quantity demanded of a product
and the percentage change in its price is calculated.
to determine the coefficient of elasticity of demand.
We now derive the formulas for the two types of elasticity of demand and apply them with hypothetical examples.
formula;
percentage change in the quantity demanded
percentage change in price.
Qo-Q1 x100
Qo
= Po-P1 x100
Po

(ii) Arc elasticity of demand.
When the quantity demanded of a product and its price change considerably that there appear two distinct points on the demand curve, the elasticity of the are made by these two points is called "arc elasticity of demand".
(iii) Geometrical Method.
This method enables us to measure the elasticity of demand at any point on the demand curve. In the above diagram, we have purposely derived a demand curve at which the tangent (MN) indicates that the elasticity of demand = 1 at point A. If the point were to be lower, then the elasticity of demand will be <1, and if the point were to be anywhere between MA, then the elasticity of demand will be > 1.

